

Research › Measuring groups
How many shots do you need?
GroupLab project, tested by Alan Hayes, researched and written with Claude. Written 2026-09-22; the data is from Closed-form statistics and simulation, seed 2026.
This article is a draft. It is not finished, it is not linked from the research index, and anything in it may change.
What we found
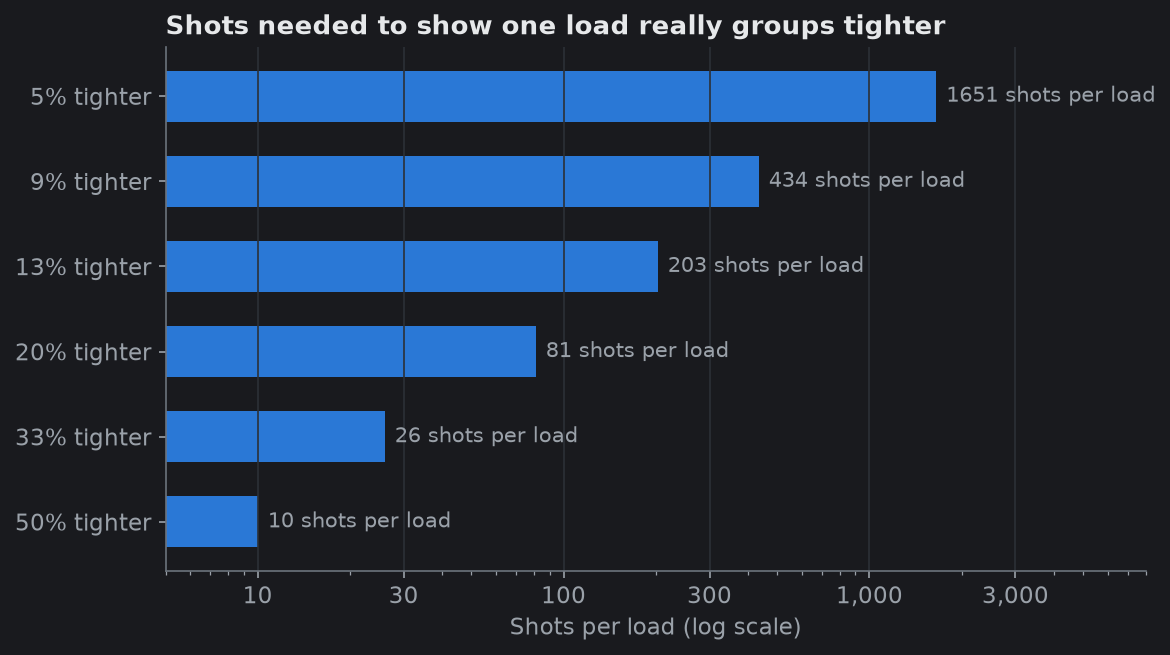
from one five-shot group, your rifle's true dispersion could be anywhere from about 0.68 to 1.92 times what you measured. At 25 shots that narrows to 0.83 to 1.25. To show that one load groups 20 percent tighter than another takes about 81 shots of each; to show a 10 percent difference takes 434.
How sure we are
these are exact results for round, flyer-free groups, the same mathematics GroupLab uses and validates against the shotGroups package. Real groups with flyers or stringing need at least this many shots, usually more.
The data
The question behind every range trip
You shoot a group, you measure it, and you want to know one thing: is this how the rifle really shoots, or did I get lucky (or unlucky)? The honest answer depends almost entirely on how many shots are in the group.
Five shots is a rough sketch
Statisticians have a precise way to say how well a group pins down the rifle's real dispersion: a confidence interval. It is the range the true value falls in 95 times out of 100.
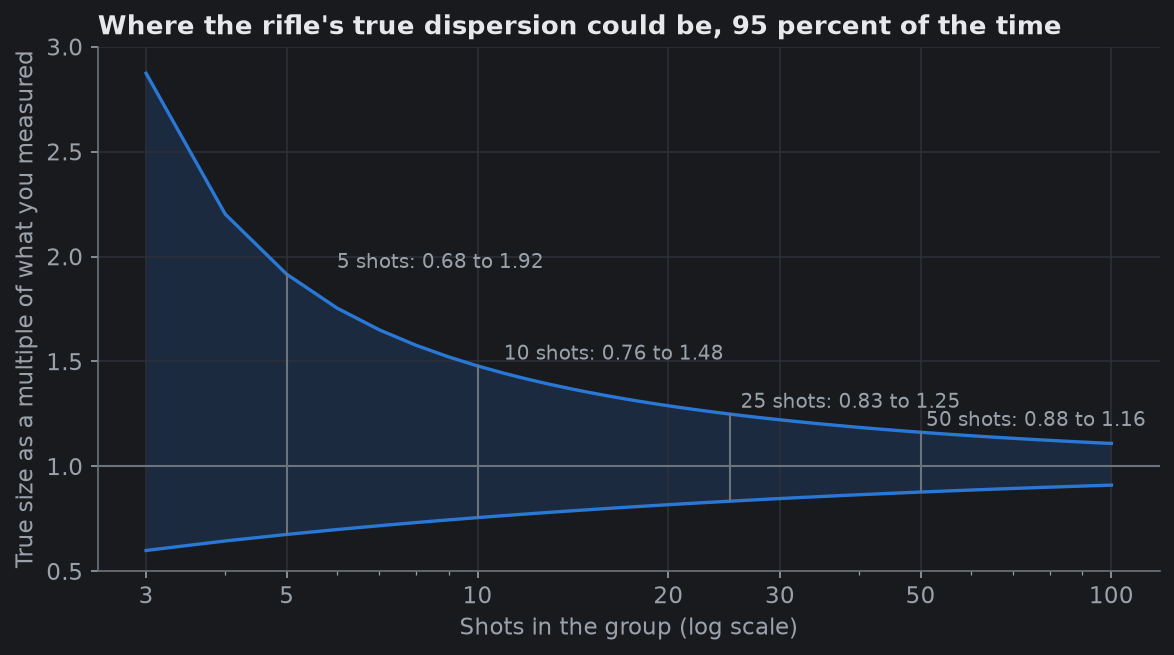
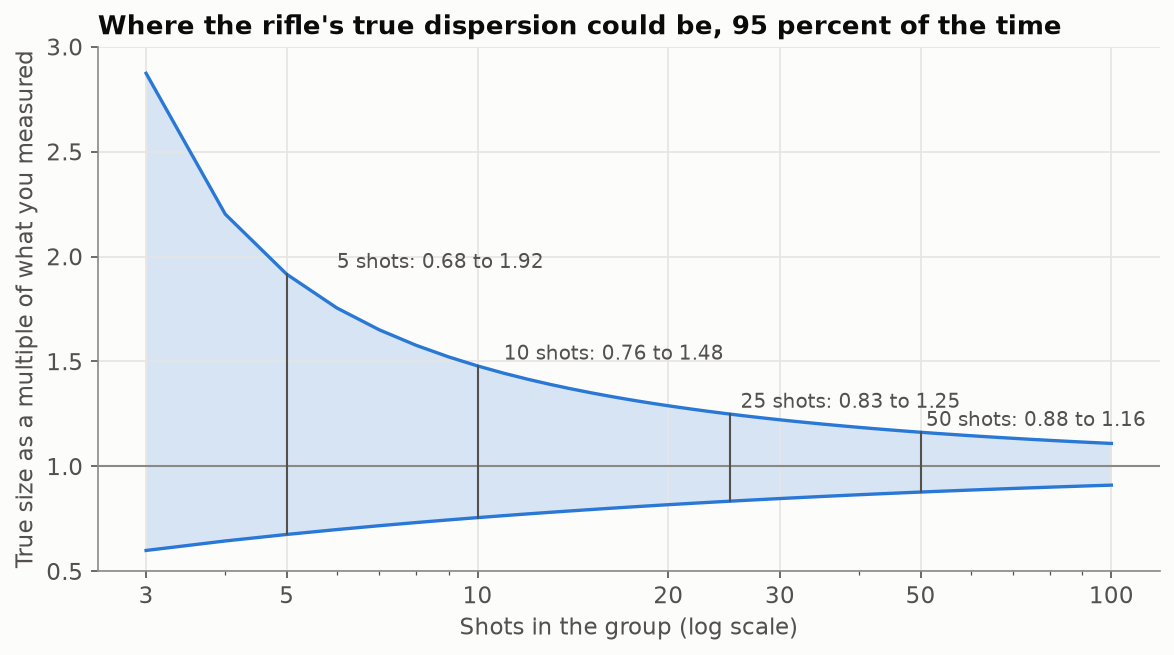
Read the chart like this. You measure a group. The shaded band shows how far the rifle's real dispersion could be from what you measured.
| Shots | True value is between | Ratio of top to bottom |
|---|---|---|
| 3 | 0.60 and 2.87 times your measurement | 4.8 |
| 5 | 0.68 and 1.92 | 2.8 |
| 10 | 0.76 and 1.48 | 1.9 |
| 25 | 0.83 and 1.25 | 1.5 |
| 50 | 0.88 and 1.16 | 1.3 |
| 100 | 0.91 and 1.11 | 1.2 |
The five-shot row is the one to remember. Two rifles whose five-shot groups differ by a factor of two can still be identical.
What that looks like on paper
Here is the same simulated rifle measured forty times: twenty times with five-shot groups and twenty times with 25-shot groups. The true value is 1.
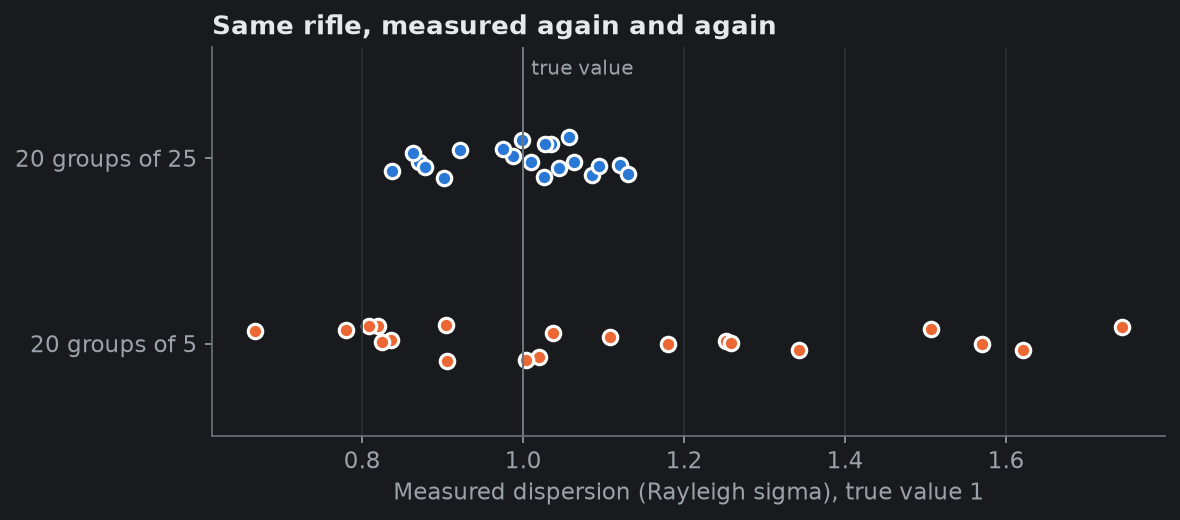
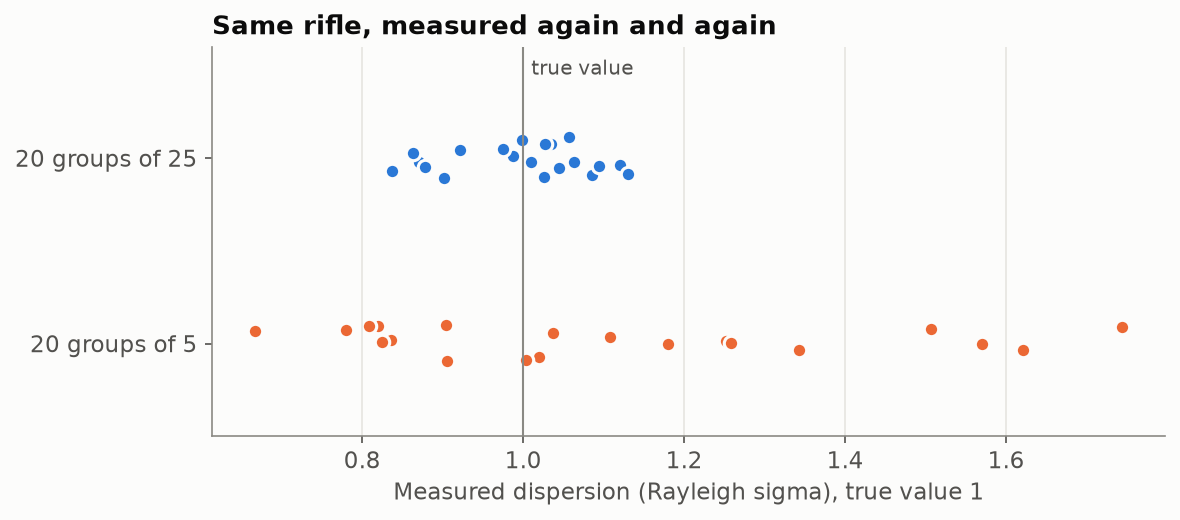
The five-shot results run from 0.67 to 1.74. The 25-shot results run from 0.84 to 1.13. Same rifle, same load, no changes. The only difference is how much evidence each measurement had.
Comparing two loads takes far more
Load development asks a harder question than "how big is this group". It asks "is load A really better than load B?" Now both measurements carry uncertainty, and the difference between them has to stand out from both.
This chart shows how many shots of each load you need to show a real difference, with an 80 percent chance of detecting it when it is there, and a 5 percent risk of seeing one that is not:
| One load really is | Shots of each load |
|---|---|
| 50 percent tighter | 10 |
| 33 percent tighter | 26 |
| 20 percent tighter | 81 |
| 13 percent tighter | 203 |
| 9 percent tighter | 434 |
| 5 percent tighter | 1,651 |
This is the table that load development by three-shot groups runs into. A genuine 10 percent improvement, which is a lot in a good rifle, takes more rounds of each load than many barrels will fire in their lives. A big difference, a third or more, shows up in a morning.
What to do with this
- Shoot more rounds of fewer things. Twenty shots each of two loads tells you more than five shots each of eight.
- Pool your groups. GroupLab can combine groups of the same load across sheets and sessions. Eight sessions of 25 shots is 200 shots: a usable sample. Eight separate 25-shot groups looked at one by one is not.
- Read the interval, not just the number. GroupLab shows every mean radius with its interval. When two loads' intervals overlap heavily, the honest verdict is "not shown yet", not "load A wins".
- Beware of many comparisons. Test six charges against each other and you are running fifteen comparisons. At a 5 percent risk each, one will look "significant" by chance about half the time. GroupLab corrects for this when it compares several loads, and says that it did.
Sources
- GroupLab statistics reference, section 9 (docs/STATISTICS.md), which also checks the approximation against an exact search.
- David Wollschlaeger, shotGroups R package. https://cran.r-project.org/package=shotGroups
- NIST/SEMATECH e-Handbook of Statistical Methods, chi-square test for the standard deviation. https://www.itl.nist.gov/div898/handbook/eda/section3/eda358.htm
- NIST/SEMATECH e-Handbook, F test for equality of two variances. https://www.itl.nist.gov/div898/handbook/eda/section3/eda359.htm