

Research › Measuring groups
Mean radius or extreme spread?
GroupLab project, tested by Alan Hayes, researched and written with Claude. Written 2026-09-22; the data is from simulation with seed 2026.
This article is a draft. It is not finished, it is not linked from the research index, and anything in it may change.
What we found
At five shots, extreme spread and mean radius are about equally noisy. As the shot count grows, mean radius settles down and extreme spread does not, because extreme spread only ever looks at the two worst shots. At 25 shots per group, extreme spread needs about 86 percent more ammunition to reach the same confidence.
How sure we are
The figures come from simulation of a well-behaved rifle (round groups, no flyers) and from the published Monte Carlo tables in the shotGroups package. Real groups with flyers make extreme spread look worse, not better.
The data
Two ways to say how big a group is
Extreme spread is the distance between the two shots that are furthest apart, centre to centre. It is quick to measure with calipers and it is what almost every shooter, magazine and forum quotes.
Mean radius is the average distance of every shot from the centre of the group. You cannot measure it with calipers, which is why it was rare before software did the arithmetic.
Both answer the same question: how much does this rifle and load scatter? They answer it with very different amounts of evidence.
Two shots against all of them
In a five-shot group, extreme spread uses two shots and ignores three. In a 25-shot group it uses two and ignores 23. Every shot you fire costs money, barrel life and time, and extreme spread throws most of them away.
Mean radius uses every shot. Each shot moves the average a little, and no single shot can move it very far.
The picture below shows ten five-shot groups from the same simulated rifle. Nothing changed between them: same rifle, same load, same shooter. Only chance changed.
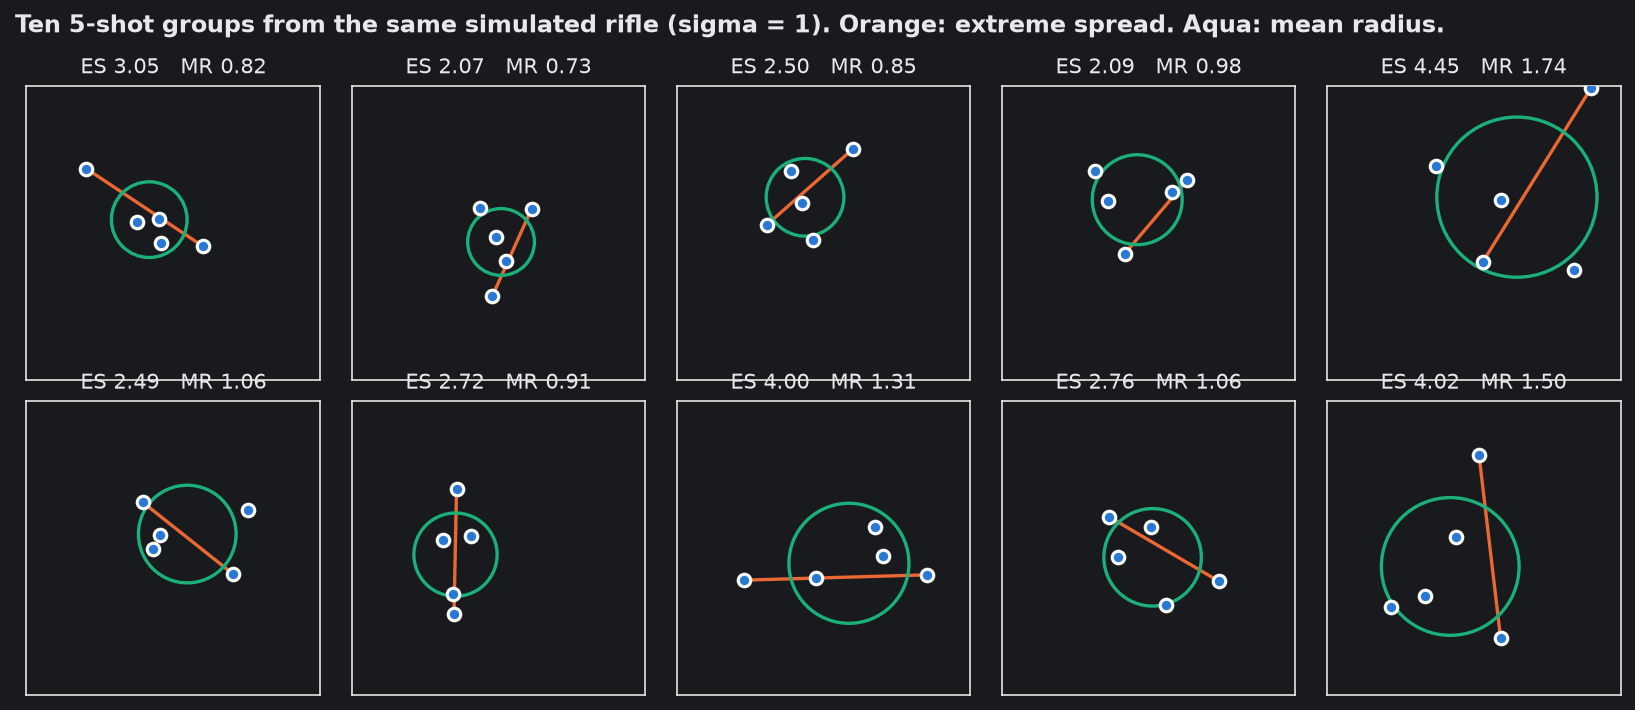
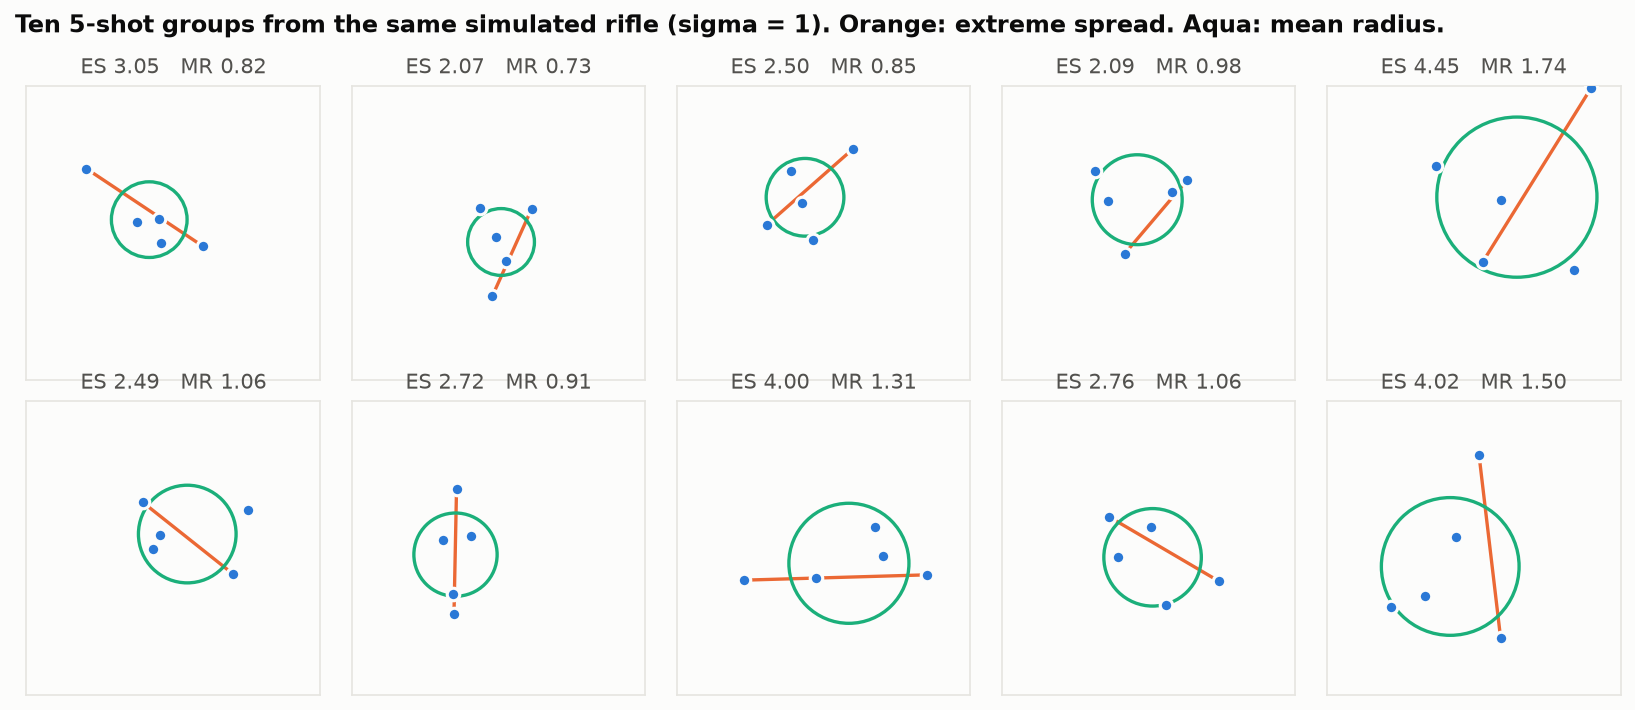
Extreme spread runs from 2.07 to 4.45, a factor of more than two. If these were real groups from ten different loads, most shooters would pick the second or fourth and call the fifth a bad load. All ten came from the same "load".
At five shots, the two are close
It would be easy to overstate the case, so here is the honest part. With only five shots, extreme spread is not throwing away much, and the two figures wander by about the same amount from group to group: roughly 26 to 27 percent either way.
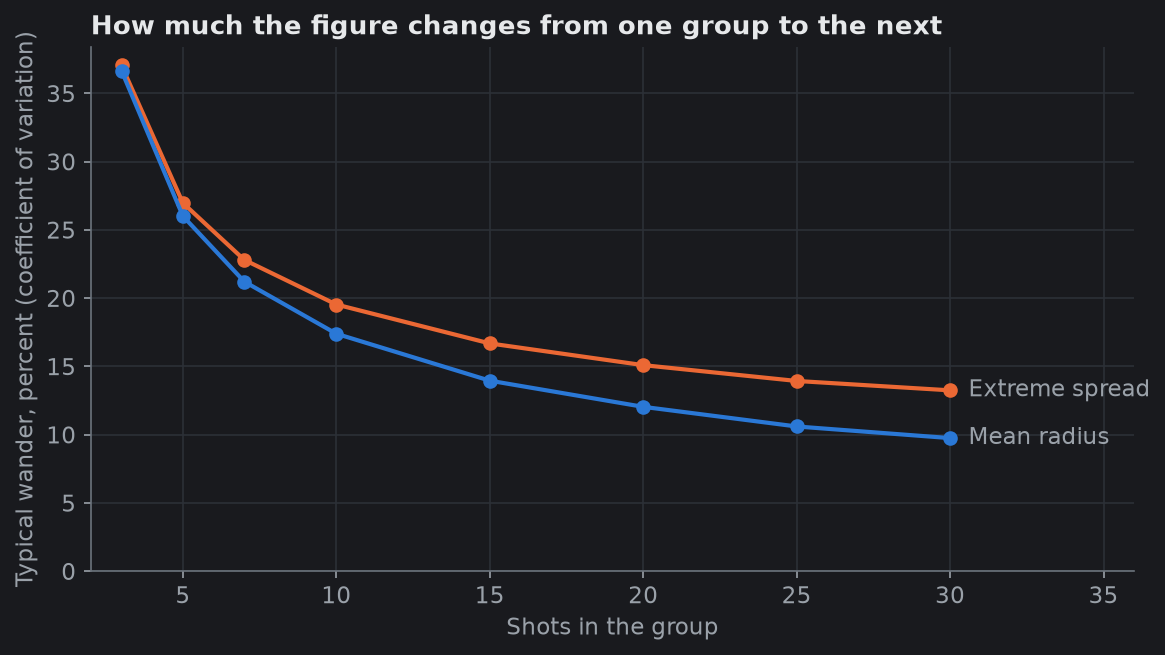
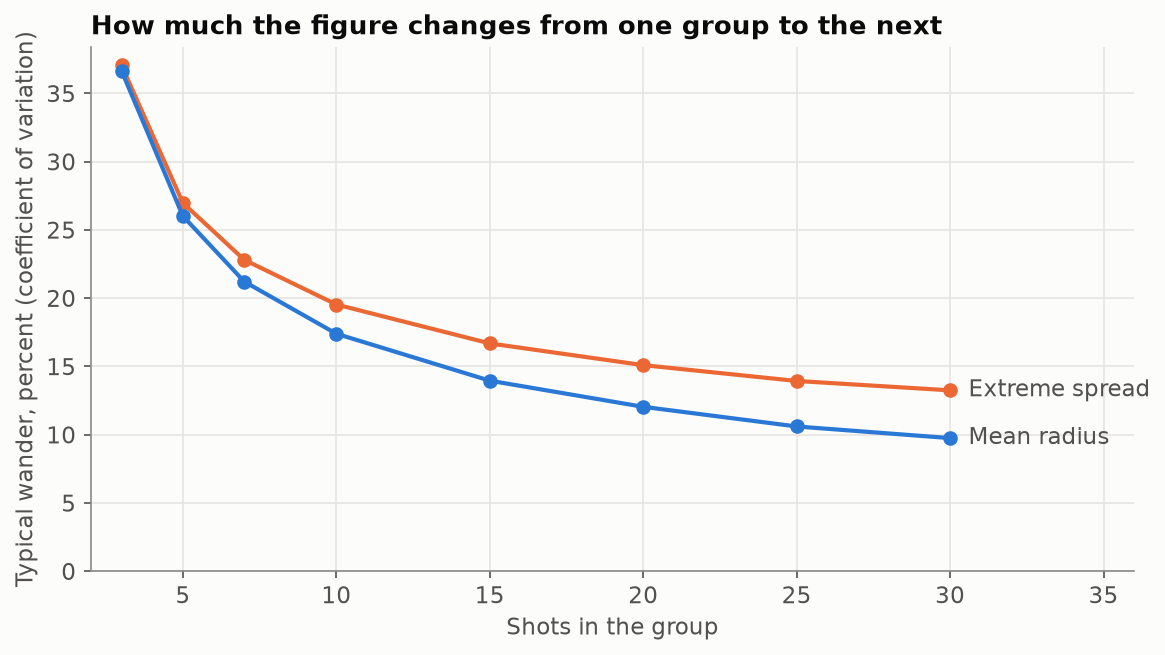
The gap opens as the shot count rises. By 25 shots, mean radius wanders by about 11 percent and extreme spread by about 14 percent. That difference sounds small, but confidence costs ammunition in proportion to the square of the noise. The shotGroups package, whose Monte Carlo tables GroupLab validates against, puts it in shots:
| Goal: a 95 percent interval 20 percent wide | Using extreme spread | Using mean radius (Rayleigh sigma) |
|---|---|---|
| From 5-shot groups | 140 shots | 124 shots |
| From 25-shot groups | 188 shots | 101 shots |
GroupLab sheets put one shot on each of up to 25 bulls, so a full sheet is exactly the case where mean radius earns its keep.
Extreme spread grows just because you shot more
There is a second problem. Extreme spread is the largest of many distances, and the more shots you fire, the more chances one pair has to land far apart. So the same rifle shows a bigger extreme spread at 20 shots than at 5, even though nothing about the rifle changed.
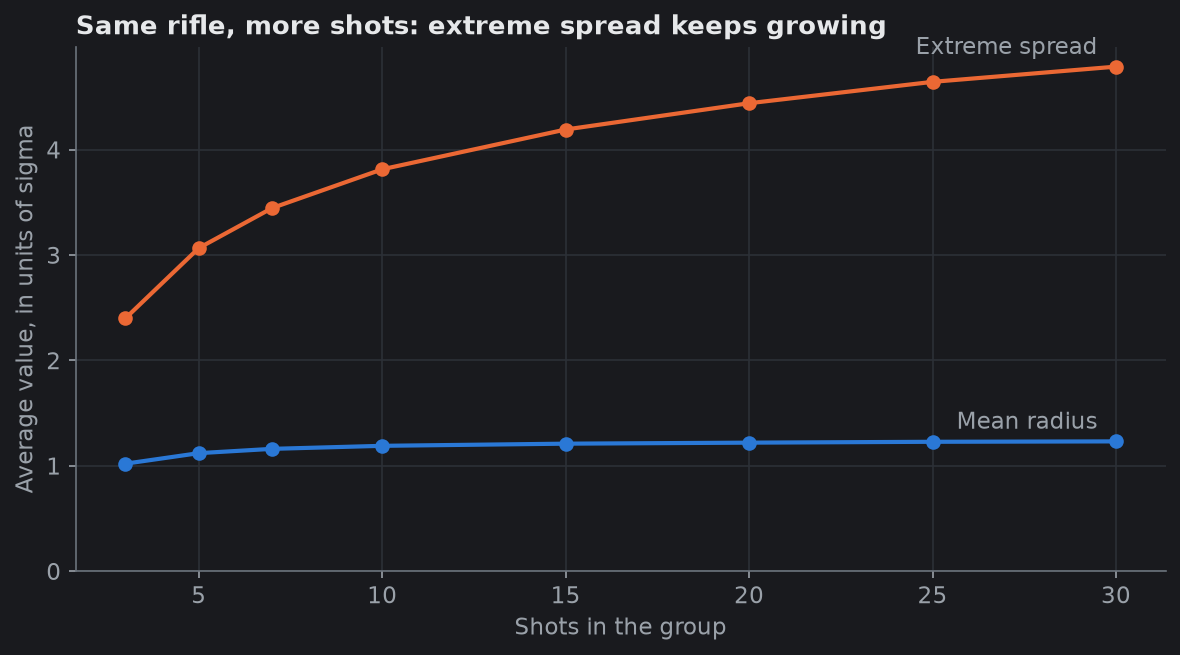
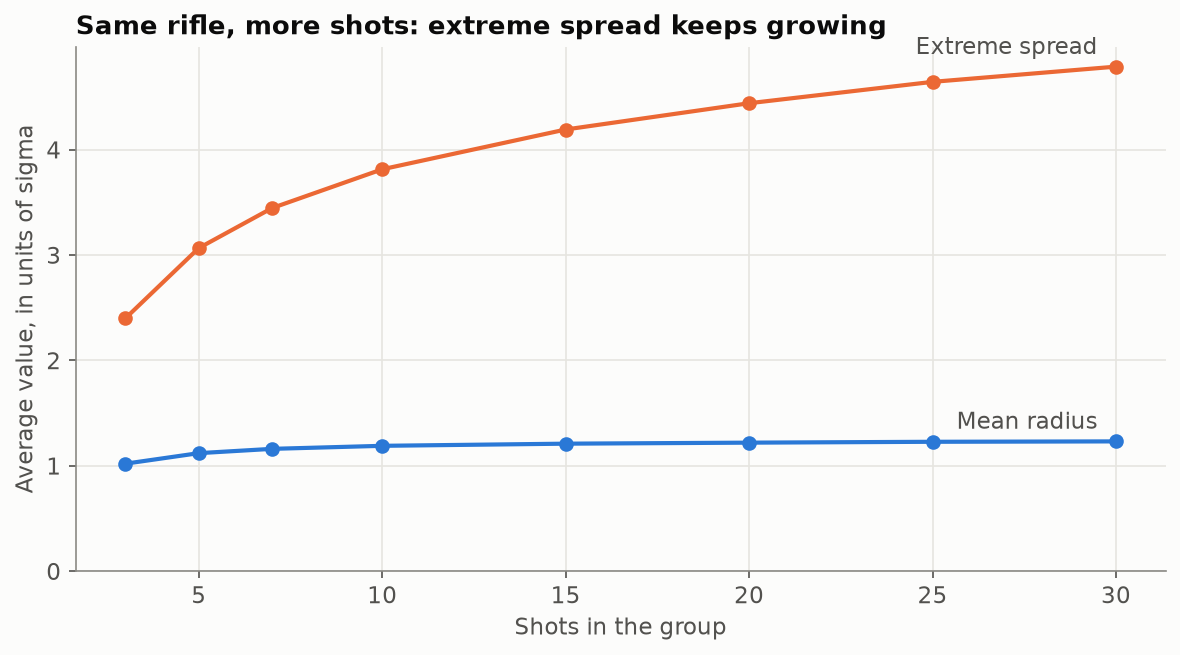
In the simulation, the average extreme spread goes from about 3.1 sigma at five shots to 4.4 sigma at twenty. Mean radius barely moves. This is why a "half-MOA rifle" by five-shot extreme spread is rarely half-MOA over twenty shots, and why extreme spreads from groups of different sizes cannot be compared at all.
(The small rise in mean radius at low shot counts is because the centre of a small group is itself estimated from those same few shots. GroupLab's headline figure corrects for this; the chart shows the raw measurement.)
What GroupLab shows
- Mean radius leads. It is the figure in amber on the results panel, with a confidence interval beside it, because it uses every shot and its uncertainty can be calculated exactly.
- Extreme spread is still there. It is the language most shooters speak, and refusing to show it would not help anyone. GroupLab shows it with its own interval, drawn as the line between the two shots, so you can see how few shots it rests on.
- Mean radius on a scale. On the analysis page you can see your mean radius per 100 yards against rules of thumb quoted on a Hornady podcast: around 0.3 inch per 100 yards is "pretty good", under about 0.2 is solid, and around 0.175 over 20 to 30 shots is "really, really good". Those marks are that source's rules of thumb, not GroupLab's measurements, and with few shots your interval will be too wide for the comparison to mean much.
If you only remember one thing
A single five-shot extreme spread tells you less than it seems to, and comparing two of them tells you less still. If you want to know whether a load is better, shoot more rounds of it and look at mean radius with its interval. The article on how many shots you need puts numbers on "more".
Sources
- David Wollschlaeger, shotGroups: an R package for analysing shooting groups, including the efficiency tables used above. https://cran.r-project.org/package=shotGroups
docs/STATISTICS.mdsections 3 and 5, where the 86 percent figure is worked out.- The Rayleigh distribution, the model behind mean radius for round groups. https://en.wikipedia.org/wiki/Rayleigh_distribution
- The mean radius scale marks, as quoted on a Hornady podcast and used in
src/GroupLab.Core/Marking/MeanRadiusScale.cs.