Tour › Compare loads
Compare loads
On this page
Two or more sessions side by side, and a plain sentence saying whether the shots actually tell them apart.
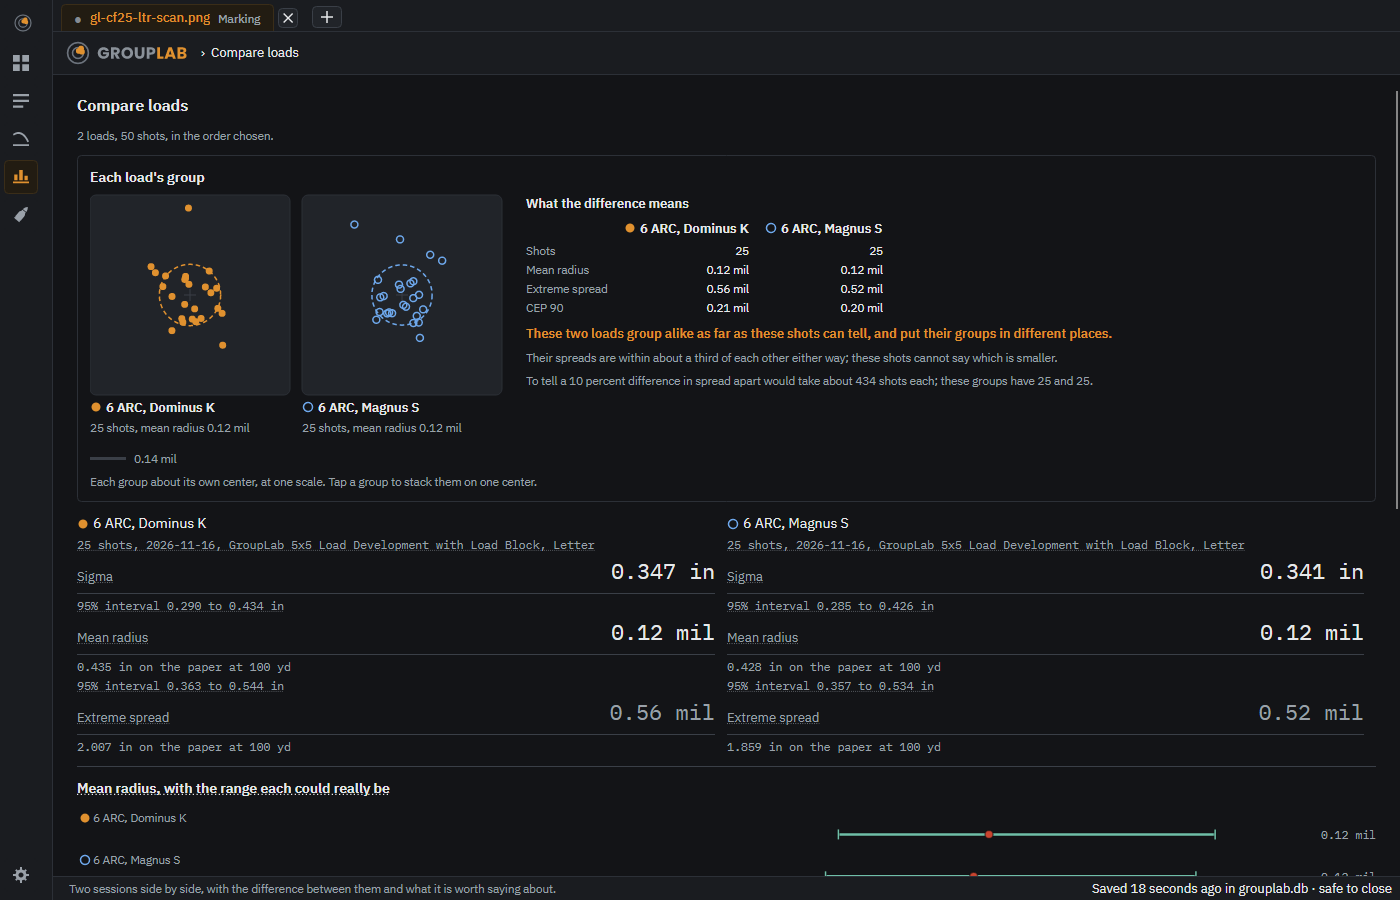
From the newest build of GroupLab, regenerated every week. Tap the picture for it full size.
On the phone since nightly 119: in Sessions, tick two or more and compare them one figure at a time, with the range each could really be. The phone's pictures now come from the Android emulator, and this screen is not yet among the ones it takes.
What this screen is for#
This is the screen that answers the question load development is for. It puts the groups beside each other, then draws each measurement as the range it could really be. Where those ranges overlap, the shots have not told the loads apart, and it says so in words rather than leaving you to read it off a chart.
Without a GroupLab sheet#
No difference, with one thing worth knowing: a hand-set scale that assumes a square-on photograph carries that assumption into the comparison, and the figures say so. What GroupLab can measure.
What you are looking at#
- The plots along the top. One per load. Dots are the shots about their own bulls, excluded ones left out, each load in its own color with a dashed circle around its group. Tap a group to stack them on one center. With two loads, What the difference means fills the rest of the card: each load's shots, mean radius, extreme spread and CEP 90 side by side, whether these shots can tell the two apart, and how many shots each would take to tell a 10 percent difference apart. The article linked below shows what two real sheets compared can say.
- The figures under each plot. Sigma, mean radius and extreme spread, with the range each could really be where one is given.
- Mean radius, with the range each could really be. Each load's name on a line of its own, and under it a line showing the whole interval with the measured value marked on it and written at the right. Two lines that overlap are two loads these shots cannot separate.
- The sentence underneath. The conclusion in plain words, and never one the verdict below disagrees with. Here: every one of these overlaps every other, so these shots do not tell them apart by this figure; where they group is another matter, in the card below.
- Sigma, with the range each could really be. The same treatment for the other measure of spread.
- The header. How many loads, how many shots in total, and that they are in the order you chose.
What you would do here#
- Tick two or more sessions in session records and press Compare the chosen.
- Read the sentence under the mean radius bars before you read the numbers.
- If the intervals overlap, shoot more of both loads rather than picking a winner.
- Look at the plots for a difference in shape that the single numbers hide.
Where it fits#
From session records. It is usually where a load development session ends.