

Tour › The analysis
The analysis
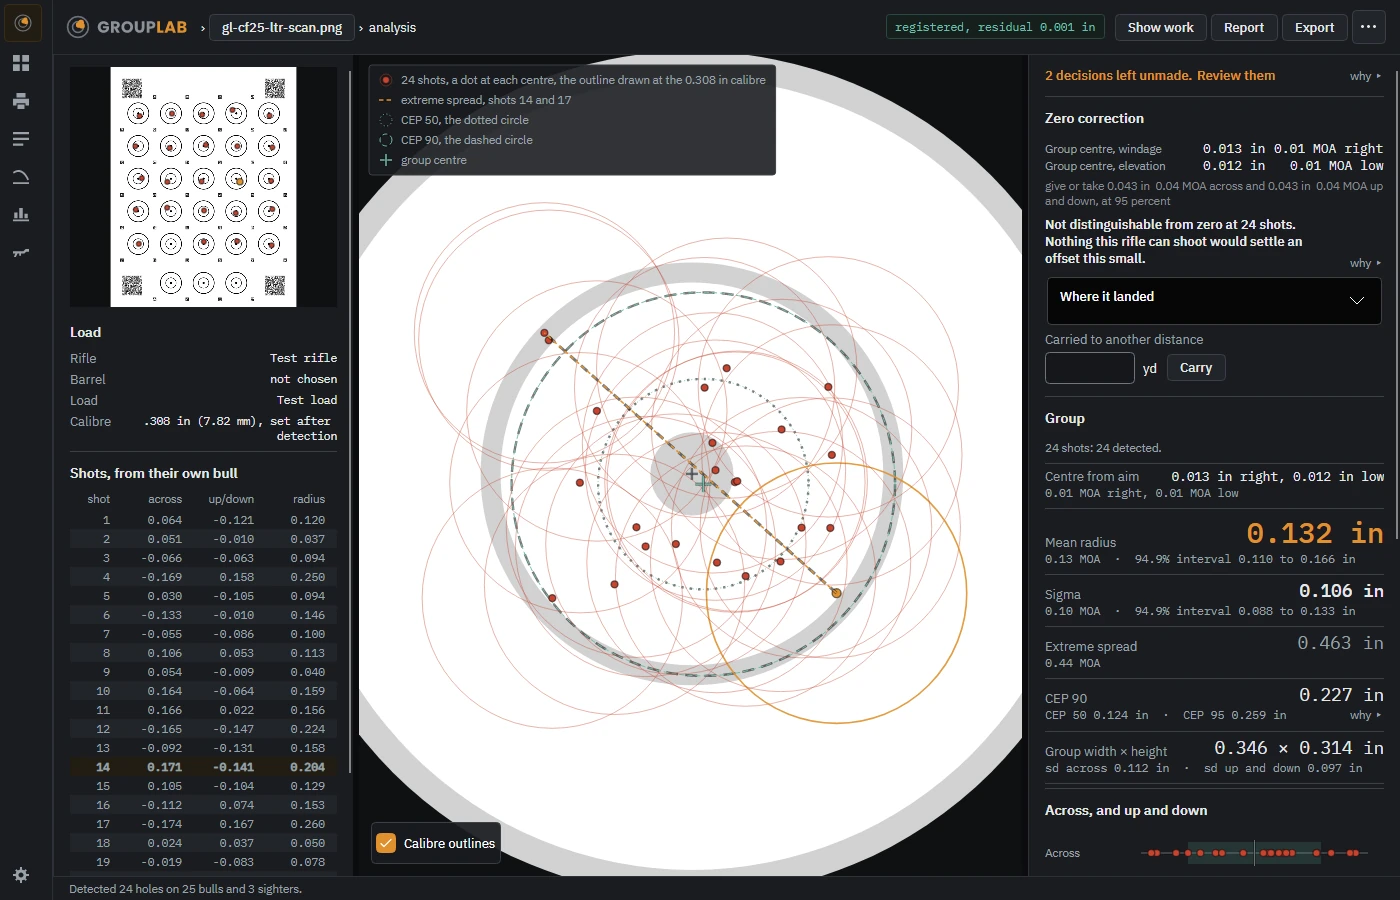
Every shot on one bull, with mean radius, sigma, extreme spread and CEP, each carrying the range it could really be.
From the newest build of GroupLab, regenerated every week. Tap the picture for it full size.
What this screen is for
Twenty-five bulls shot one round each become one picture of twenty-five shots, because each shot is measured from its own bull. Every number here comes with an interval, which is the range the true value could really be given how few shots you fired. That is the difference between knowing a load is better and hoping it is.
What you are looking at
- The composite, in the middle. A dot at each shot's centre, drawn where it landed relative to its own bull. The circle around each dot is the calibre outline, so you can see how much of the group is bullet and how much is dispersion.
- The key, top left. What each mark means: the extreme spread pair, the dotted CEP 50 circle, the dashed CEP 90 circle, and the cross at the group centre.
- Zero correction. How far the group centre is from where you aimed, across and up and down, in inches and in your angle unit, with the give or take. Underneath, in plain words, whether that offset is distinguishable from zero at all with this many shots.
- Carried to another distance. The same correction worked out for a different range.
- Group. How many shots you said, how many were detected, and then the measurements. Mean radius is shown largest because it is the one that settles down fastest with few shots.
- The intervals under every number. Mean radius 0.132 inches with an interval of 0.110 to 0.166 is not the same claim as 0.132. Two loads whose intervals overlap have not been told apart.
- Across, and up and down. The same shots seen one axis at a time, which shows a vertical or horizontal string that the round picture hides.
- The load block, left. Which rifle, barrel, load and calibre this sheet was shot with, and where the calibre came from.
- Shots, from their own bull. Every shot as numbers, across, up and down, and radius. The widest pair is picked out in bold.
- Show work, Report and Export. Show work opens the reasoning behind every figure. Report makes a printable page. Export writes the numbers out.
What you would do here
- Read the mean radius and its interval before anything else.
- Check the zero correction, and read the sentence under it saying whether the offset is real at this many shots.
- Look at Across, and up and down for a string in one axis.
- Press Show work on anything you want the reasoning for.
- Report or Export if you want to keep it outside GroupLab.
Where it fits
After marking. The session is saved to session records, where two can be sent to compare loads.